1) Initialize
2) Select Quality Improvement Toolkits
Available Toolkits:
State Geographic Analysis
This tab is dependent on results of the “Run Simulation” tab. If you do not run the simulation, these visualizations will remain blank.
Welcome to the Maternal Mortality and Morbidity Interactive Dashboard
The Maternal Mortality and Morbidity Interactive Dashboard (3MID), a microsimulation and policy simulator, allows users to analyze how budgeting, social determinants of health, medical interventions, and policy could reduce rates of maternal morbidity and mortality across the United States. It incorporates local factors, including state-specific demographics and resources to enhance outcomes for priority populations, e.g., rural residents, racial and ethnic groups, and groups that have been economically marginalized. This tool will empower users to make data-driven decisions and reduce maternal morbidity and mortality rates within their states.
Background
Maternal Mortality and Morbidity in the U.S.The United States is the only developed nation in the world with an increasing maternal mortality rate. Nearly 1,000 women die each year from pregnancy or pregnancy-related complications. Approximately 50,000 women suffer from severe complications of pregnancy (e.g., severe maternal morbidity) (CDC, 2014). Non-Hispanic Black and American Indian/Alaska Native women are 2-3 times more likely to suffer a pregnancy-related death than Non-Hispanic White women (CDC, 2016). Additionally, Black and AI/AN women experience SMM at a rate up to two times higher than that of White women (ASPE, 2021). Many rural counties have also lost their hospital-based obstetric services, creating “obstetric deserts” where women must travel long distances to access care.
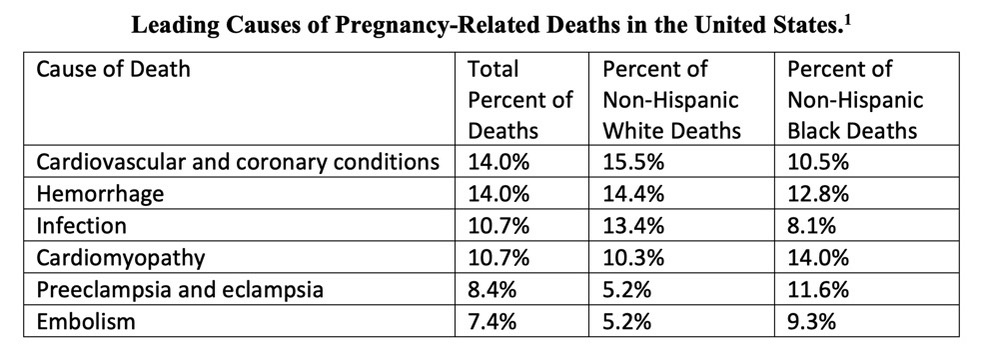
The most prevalent pregnancy-related causes of death are shown in the table below, as noted in the Maternal Mortality Review Information Application (MMRIA) report from 2018 (Brantley, et al. 2018):

Toolkits
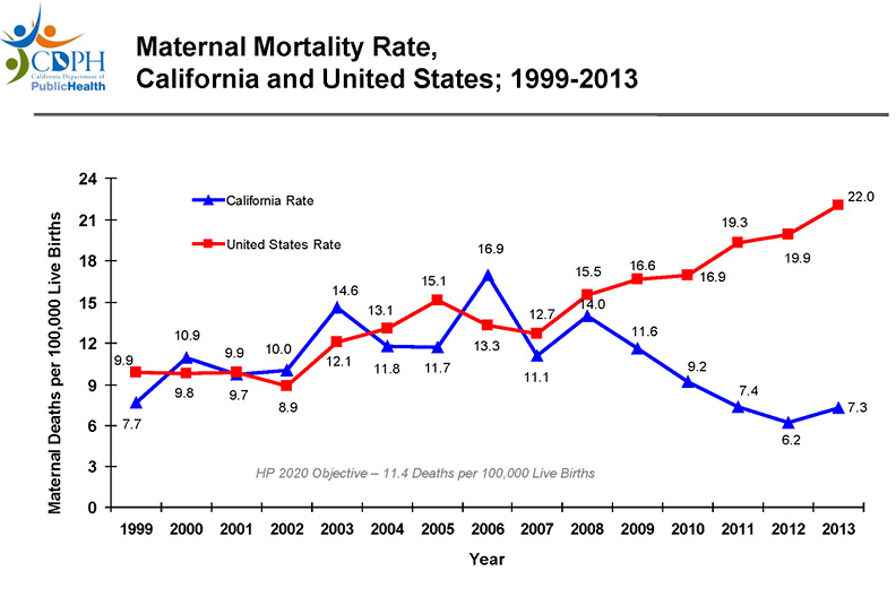
This health crisis has prompted many states to stand up research committees and partnerships for the purposes of reducing maternal morbidity and mortality. One of the most successful of these committees is the California Maternal Quality Care Collaborative (CMQCC), which relies on four pillars: Data, Quality Improvement, Education and Partnerships. The CMQCC Maternal Data Center (MDC) is an online web tool where hospitals can benchmark their performance. Over 96% of California’s maternity care hospitals use the MDC. CMQCC also created a number of “toolkits” for the purposes of addressing the most common causes of preventable pregnancy-related deaths. Each toolkit, focused on a single cause of mortality or morbidity, includes a “compendium of best practice tools and articles, care guidelines in multiple formats, hospital-level implementation guide, and professional education slide set.” , With the development of these toolkits beginning in 2006, and their implementation in 2009 (Main, Markow and Gould 2018), the rate of pregnancy-related deaths in California by 2013 has been cut in half, to a three-year average of 7.0 deaths per 100,000 live births. CMQCC also helps clinicians stay up to date on the latest in maternal quality improvement and engage with partners throughout the state around aligned goals.

Another example of a successful partnership is the Council on Patient Safety in Women’s Health Care’s Alliance for Innovation on Maternal Health (AIM). AIM is a national data-driven maternal safety and quality improvement initiative, which was created based on the success in California. Like CMQCC, AIM has a data center for performance benchmarking, toolkits (e.g., bundles), and educational materials for their members. Many states have implemented one or many bundles, which have resulted in a direct reduction in specific causes of maternal mortality and morbidity.
Preventability
Of the pregnancy-related deaths in the U.S., 66% are preventable (Petersen, et al. 2019). Severe maternal morbidity is associated with a high rate of preventability, similar to that of maternal mortality (ACOG, 2016). To calculate the effectiveness of the CMQCC toolkits and AIM Bundles, 3MID combines available data on preventability with leading cause of pregnancy related death, in order to estimate the number of maternal deaths that could be prevented with the selection of each toolkit.
Partnership with March of Dimes
MITRE partnered with March of Dimes , the nation’s leading nonprofit fighting for the health of all moms and babies, due to multiples synergies between the two organizations. These include not-for-profit status, focus on data-driven outcomes, and shared mission to improve the health and well-being of mothers and babies. A key partnership goal involves integrating 3MID within March of Dimes’ PeriStats tool. This public-facing website provides open access to maternal and infant health data, including rates of C-section, pre-term birth, and death. PeriStats’ roughly 15,000 users per month range from congressional staffers to state legislators to researchers. Including 3MID gives policy-makers access to a tool that could significantly improve their jurisdictions’ maternal health outcomes.
(1) Brantley, Mary D, William Callaghan, Andria Cornell, Shanna Cox, Nicole Davis, Sarah Foster, David Goodman, et al. 2018. "Report From Nine Maternal Mortality Review Committees."
Who should use 3MID?
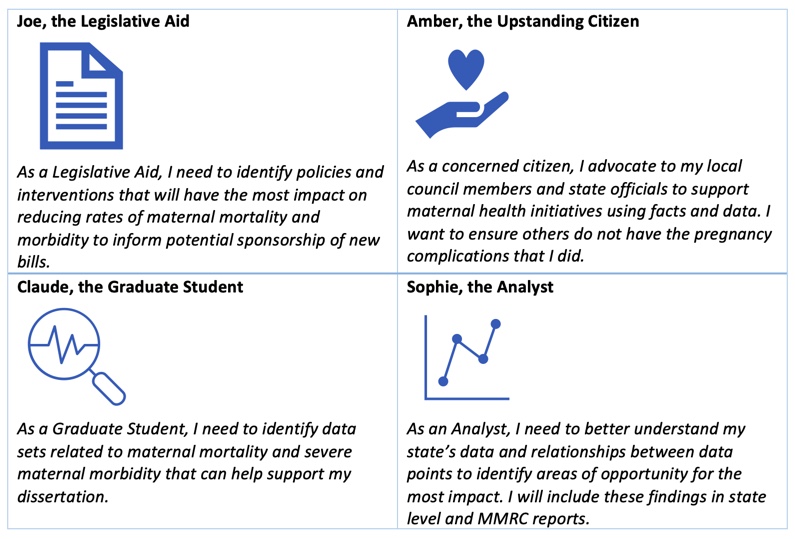
Review the below use cases to learn about how 3MID can be used to make data-driven decisions on maternal mortality and morbidity rates…

Let’s Dive Deeper into the Use Cases…
Use Case 1: Joe, the Legislative Aid
Joe is a legislative aide for an Ohio Congresswoman. A new bill is going to be introduced in Congress to increase funding for maternal health data collection and programming.
Joe was tasked by his boss to figure out if the Congresswoman should co-sponsor the bill and what the rates of maternal mortality and morbidity will be in Ohio over the next few years.
Joe can use 3MID to predict the number of pregnancies in Ohio over the next few years and the likely number of maternal deaths that will occur in Ohio with and without intervention (broken out by non-Hispanic Black, non-Hispanic white, Hispanic, and other). Joe can also identify what policies and interventions will have the most impact on reducing rates of maternal mortality and morbidity for underrepresented groups and the cost of those interventions.
Overall, the 3MID report will help Joe make data-driven recommendations for the Congressman.
Use Case 2: Amber, the Upstanding Citizen
Amber is a resident and registered voter in Arlington, VA. She often works at the voting polls and is very active in local and national politics. As a mother of three, Amber is very familiar with the potential complications that can arise during pregnancy. She suffered from severe postpartum hemorrhage and required multiple blood transfusions. Because of this, Amber advocates for local council members and state officials who support maternal health initiatives.
Amber went to use 3MID. She looked at the rate of maternal disorders within Arlington county and how Arlington county compared to other counties within the DMV area. She identified areas with high rates of maternal disorders within the DMV and what interventions might have the most impact. She advocated to her local representatives for additional funding and media attention around maternal health programming, particularly for the areas in the most need.
Use Case 3: Claude, the Graduate Student
Claude is a graduate student at Purdue University. For his dissertation, he is examining maternal mortality and severe maternal morbidity from preeclampsia within Indiana. Due to the privacy concerns surrounding maternal health data, Claude is having difficulty obtaining access to the data he needs for the study design.
Claude went to the PeriStats website and ran 3MID simulations focused on preeclampsia within Indiana. He then downloaded the Indiana synthetic population. He used this data set for his analyses and incorporated the findings into his thesis dissertation
Use Case 4: Sophie, the Analyst
Sophie is an analyst at the Georgia Department of Health and helps analyze data for Georgia’s Maternal Mortality Review Committee (MMRC).
Through her roles, Sophie has access to Georgia’s identified maternal health data and is responsible for deidentifying and aggregating the data for reporting to the
Centers of Disease Control and Prevention (CDC) and MMRC reports.
Before doing so, Sophie would like to identify data points related to maternal deaths in the state of Georgia, such as race and ethnicity, preventability by condition and race, birthing facility, health insurance coverage, comorbidities and occurring diagnoses. She would like to correlate Georgia’s maternal death with the following data points and allow for comprehensive analysis and bring to light the relationships among these factors.
She can do this by downloading 3MID onto her desktop, uploading Georgia’s identified data within the secure confines of her laptop/system, and running the simulation based on her selection of inputs. Only Sophie would have access to her simulation runs. The outputs of the simulation can help Sophie better understand her populations and identify areas of opportunity for the most impact. The findings can also be incorporated into Georgia’s MMRC report.
3MID User Guide
The following information will guide you on how to use the “Run Simulation” tab for the 3MID Tool.Step 1: Select Parameter
The population will be filtered based on the selection of inputs below.- Choose a state from the Select a State dropdown.
- Choose localities (e.g., counties, parishes) from the Select Localities dropdown.
- Choose hospitals from the Select Hospitals dropdown. If you wish to include all hospitals within a given state, click Select All. If no hospitals are selected, all hospitals will be displayed on the map but not included in the simulation.
- Choose an outcome (e.g., maternal mortality, severe maternal morbidity) from the Outcome dropdown.
- Click SETUP POPULATION to populate the map on the State Geographic Analysis.
- The dots on the map represent women from four race/ethnicity groups.
- Click on the hospitals on the map to learn about the teaching status, capacity, rurality, or overall capacity of the selected hospital.
Step 2: Select Quality Improvement Toolkits
- The Available Toolkits are interventions that are designed to reduce the leading causes of pregnancy-related death.
- Check the Available Toolkits you wish to deploy in the simulation.
- Choose a timeframe (e.g., 1-, 3-, 5- Years) on the Select Simulation Timeframe dropdown.
- Click RUN SIMULATION to see the results.
- Results will vary based on the selected inputs in Step 1 and Step 2. If a small number of parameters were selected, the outputs (e.g., number of deaths or morbidities) may be small.
- If you would like to reset the parameters of the simulation, click Reset Parameters.
Step 3: Interpreting the Results
- The default display will be Results for All and Preventability for All. This will include the aggregated results for all race/ethnicity groups: Non-Hispanic White, Non-Hispanic Black, Hispanic, and Other.
- To review the results of the simulation by race/ethnicity group, click Results by Race. To review the Preventability results by race/ethnicity group, click White, Black, Hispanic, or Other. The colors of the boxes correspond to the legend on the map.
- Results for All or Results by Race includes the Average Risk, Pregnancies, and Outcome based on the selected inputs from Step 1 and Step 2.
- Preventability for All or White, Black, Hispanic, or Other includes the numbers of deaths or morbidities that were prevented based on the selected inputs from Step 1 and Step 2.
- Click Estimated Cost to review the cost of the simulation run. This is dependent on the number of hospitals and toolkits that were selected. If you did not select hospitals in Step 1 or toolkits in Step 2, the calculation will be zero.